Fundanet Home Page
- 24 Sep 2024
- 3 Minutes to read
- Print
- DarkLight
- PDF
Fundanet Home Page
- Updated on 24 Sep 2024
- 3 Minutes to read
- Print
- DarkLight
- PDF
Article summary
Did you find this summary helpful?
Thank you for your feedback!
Fundanet home page
Once you are logged in, you will find the following navigation choices:
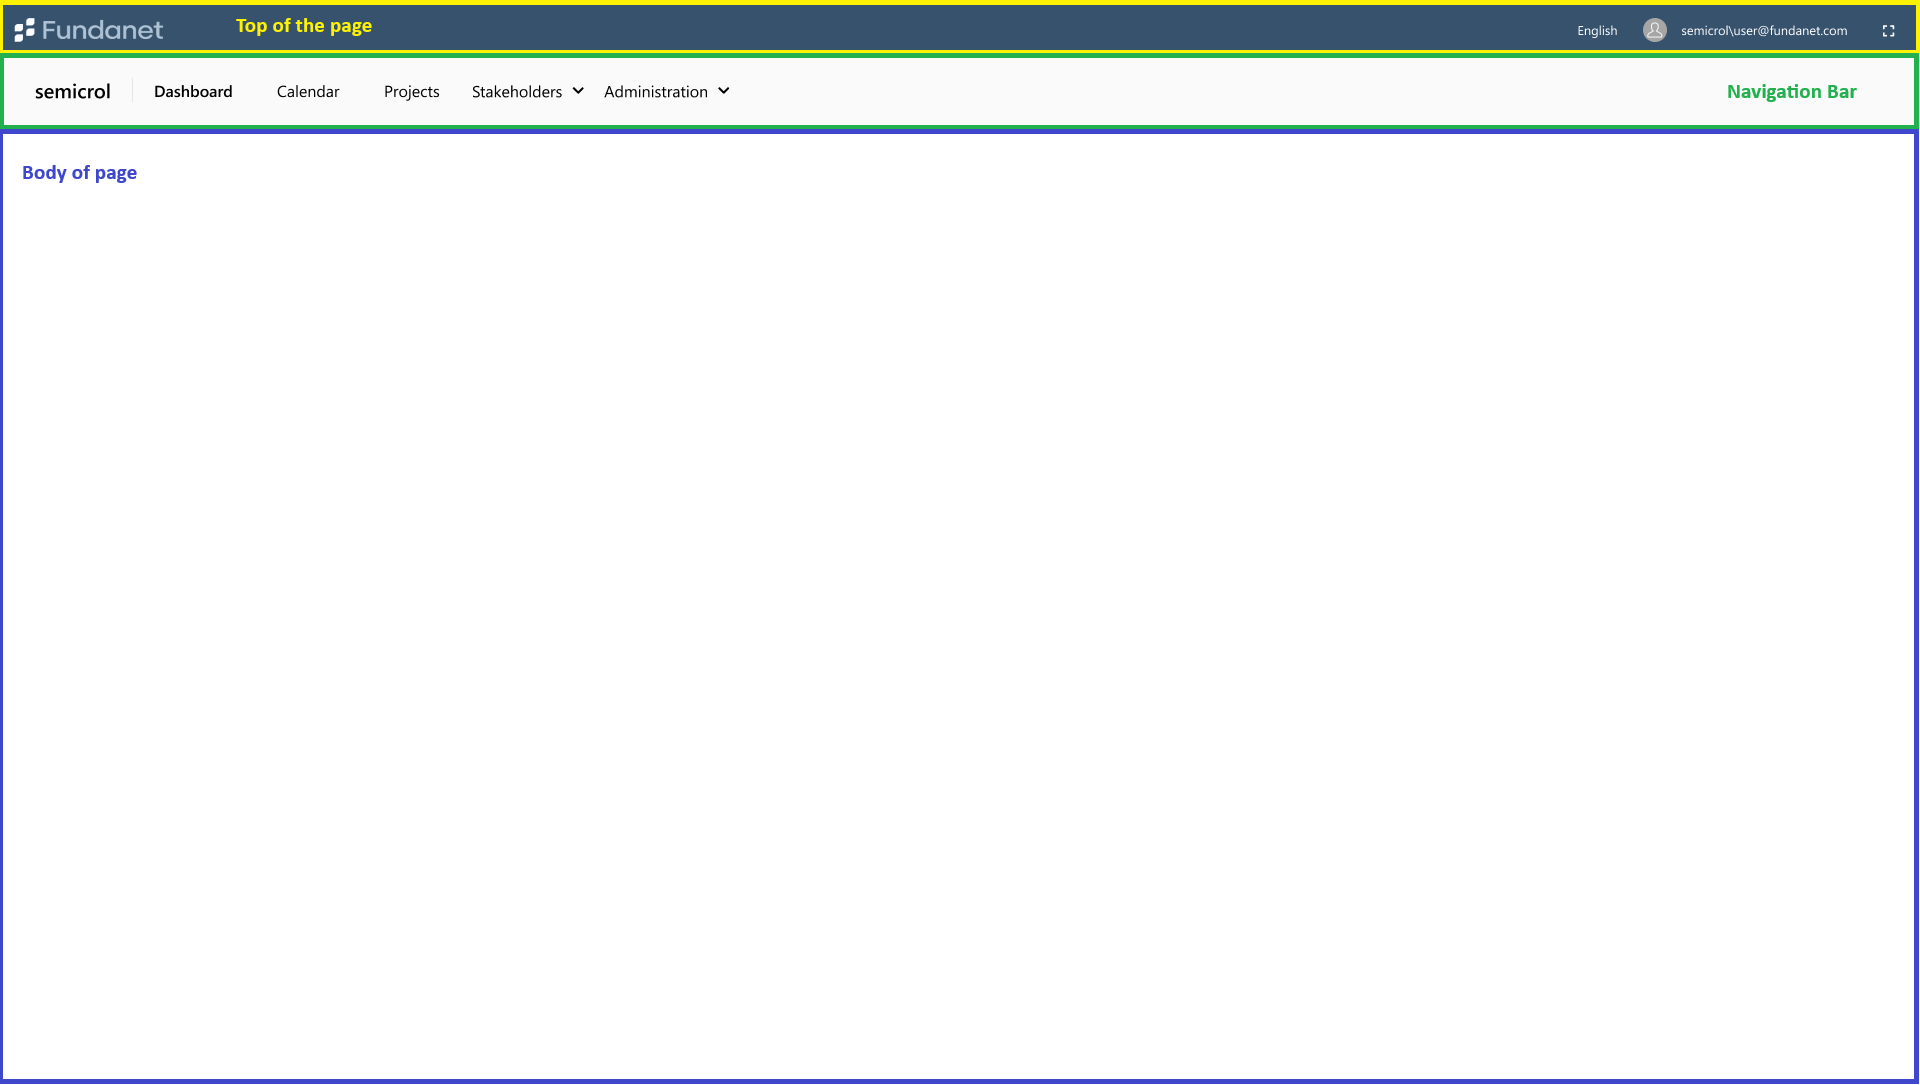
Top of the page
In the top left corner of the page, you will find the logo of the application you are using. In the top right corner, you will find the following elements:
- Language options
- User avatar
- Username
- Full screen icon

The language selection will show the language the system is currently being displayed in. By clicking on "language", a menu will open for you to switch languages. Current available languages are English, Spanish and Portuguese.
By clicking on your username, you will be able to log out of the system.
Lastly, you will find an icon that will allow you to activate the full screen mode. This will make both the screen of your Fundanet app and the taskbar bigger, while the tab selection of your browser will become non-visible. Once activated, you can exit full screen by pressing "Esc" on your keyboard or clicking once more the compress screen icon, which will have replaced the full screen one.
Navigation bar
Below the top of the page bar, you will find the navigation bar. On the left side, you will see the name of the organization where you are recording data. This name should match the organization name entered during the login process.
Directly below this you will find a set of menu options that will vary based on your role and user permissions. Some of the options may have an arrow, which will indicate that there is a second level to the menu. By clicking on the arrow, a new bar will open below the navigation bar with additional menu options.
Body of page
The body of the page will vary as you navigate the different menu options. The detail of each of these options will be explained in their respective manuals.
When you first log into the system, you will be redirected to the dashboard. There, you will find four different sections: quick actions, notes, cue items and reports.
I cannot see four sections
It's important to note that the amount of information you see will depend on your user role and permissions. Also, depending on the app you are using, there could be additional specific sections. You can find information about those in the respective dashboard sections of your app.
Each of these sections can be distinguished by a title. By clicking on a title, you can hide and show the items it contains.
Quick actions
Here you will have access to some of the most common operations and features available in your app. There can be different types of actions, that you will be able to identify based on the icon next to each of them:
| Icon | Operation |
|---|---|
| Create | |
| Import | |
| Export | |
| Remove | |
| Other operations |
Notes
The system allows for users to leave notes for each other, as you will be able to see in the Insights > Notes section on Fundanet Entity Details Page
In the dashboard, you will be able to see all the unread notes that have been addressed to you as a user or to your user role. As soon as each note is opened, it will be considered read and will disappear from the list displayed in the dashboard. If a note is marked as unread, it will continue to show up in the dashboard.
The list of notes will include a link to the item in which the note has been created. By clicking on the link, the system will open the item's detail page, as well as the note. Also, the users will be able to see in the list the creator of the note, the date when it was created, and the recipient of the note and the message.
Tiles
In this section, there will be a set of indicators that summarize the information registered in the system. They will show a description of the information they represent, and a calculation based on the information recorded in the system that matches the description. By clicking on the tile, the user will be redirected to a list of the items being accounted for.
Reports
In the last section of the dashboard, we will find some reports that, as the tiles do, show a summary of the information that has been recorded in the system. Unlike the tiles, these graphs are not clickable.
Was this article helpful?